What Recruitment KPIs Should You Track?
· 8 min read
You should track four recruitment KPIs: quality of hire, time to hire, cost per hire, and 90-day retention, the metrics that tie each hiring decision to a business outcome. Read each as leading or lagging: a 90-day attrition trend warns a full quarter before annual turnover moves, and replacing one frontline hire costs $5,000-$20,000 while skilled roles run 50-200% of salary (SHRM). Your quality-of-hire number is only as good as the screen behind it, and the gap is stark: a gut-feel interview correlates with actual performance at about 0.18, whereas a structured interview paired with validated assessments carries the signal past 0.6.
Which recruiting KPIs matter most?
**The recruiting KPIs that matter most are the four that tie a hiring decision to a business outcome: quality of hire, time to hire, cost per hire, and early retention. Everything else is either an input to one of these or a vanity count that fills a slide without changing a decision. If a number cannot finish the sentence "so we will do X differently," it does not belong on the dashboard.
Quality of hire is the anchor because it answers the only question that ultimately matters: did this person perform and stay? Time to hire and cost per hire are the efficiency pair, how fast and how cheaply you reach a good hire, and early retention is the honesty check that catches a fast, cheap hire who walks at week six. Read them together. A team optimizing time to hire in isolation will eventually trade speed for mismatch, and the cost per hire number looks great right up until you pay to replace the person.
The concrete example: a contact-center team celebrates filling 200 seats in three weeks at a low cost per hire, then watches roughly half leave inside 90 days. The vanity KPIs (req fill speed, low cost) all glowed green; the outcome KPI (early retention) was red the whole time and nobody was looking. The edge case is the senior or specialist hire, where volume metrics barely apply. There, quality of hire and time-to-productivity dominate, and a slow, expensive search can still be the right call.
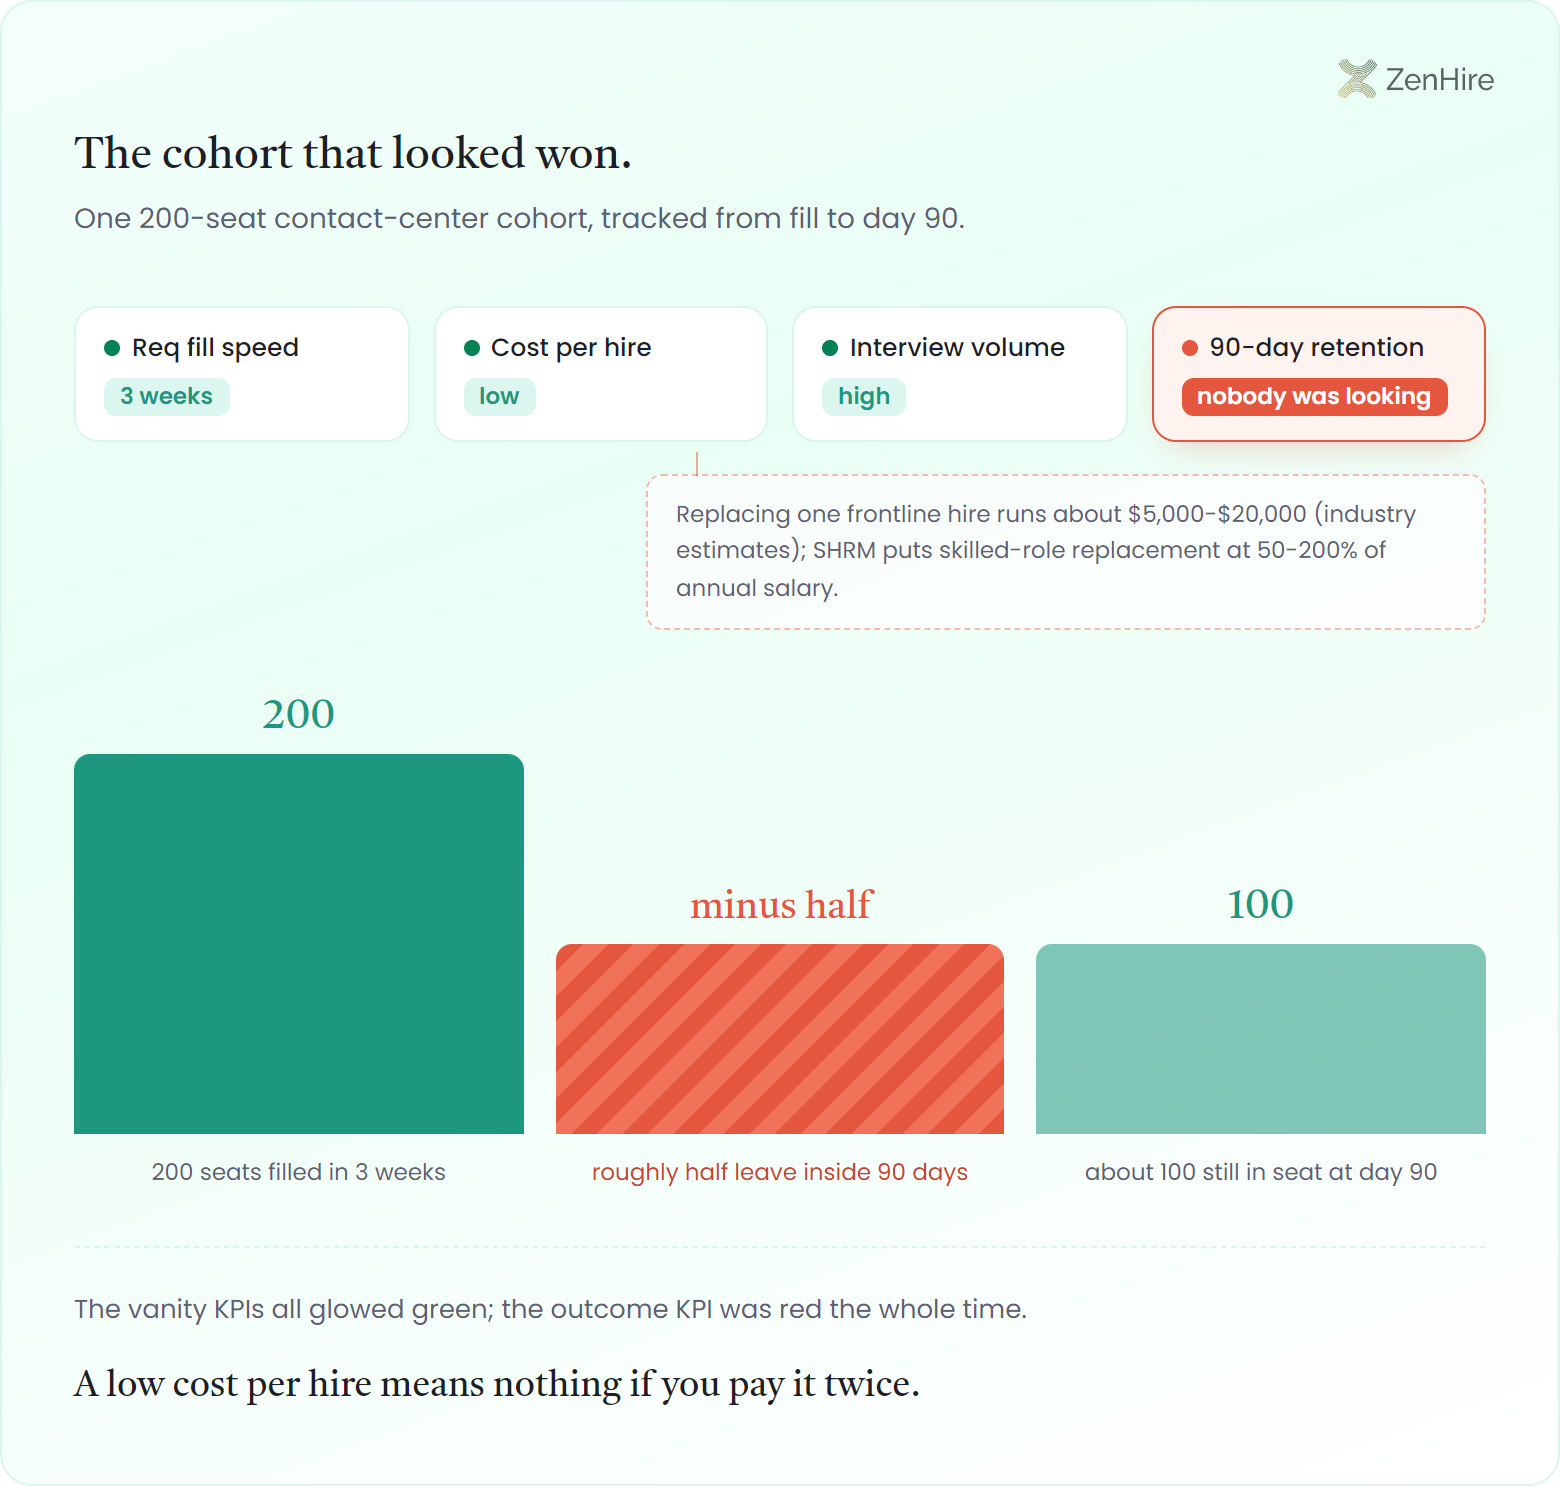
Replacing one frontline hire runs about $5,000-$20,000 (industry estimates), and SHRM puts skilled-role replacement at 50-200% of annual salary. That is why early retention, not raw fill speed, is the KPI that protects the budget: a low cost per hire means nothing if you pay it twice.
- Quality of hire: does the person perform and stay? The anchor KPI everything else serves
- Time to hire: elapsed days from open req to accepted offer; a good seat unfilled is a revenue leak
- Cost per hire: fully loaded spend per accepted offer, including sourcing, tooling, and recruiter time
- 90-day retention: the share of new hires still in seat at 90 days; the honesty check on the three above
What is a leading versus lagging recruiting KPI?
A leading recruiting KPI predicts an outcome before it lands, while a lagging KPI confirms it after the fact, and a healthy dashboard pairs them so you can steer instead of just score. Leading KPIs are early warnings you can still act on; lagging KPIs are the verdict that tells you whether the action worked.
The mechanism is timing. Annual turnover is a textbook lagging KPI: by the time it moves, the hires that caused it were made months ago and the money is already spent. A 90-day attrition trend is the leading version of the same signal: if a sourcing channel or a screening change starts producing more early quits, you see it a quarter before the annual rate budges, while you can still cut the channel or fix the screen. The concrete example: a recruiter notices structured-interview pass rates dropping for one location's applicants (leading) weeks before that location's quality-of-hire scores fall (lagging), and reallocates sourcing spend before the bad cohort is even hired.
The edge case is a leading KPI that drifts from the outcome it is supposed to predict, a classic Goodhart problem. Optimize "interviews scheduled per recruiter" and you will get more interviews, not better hires; the proxy gets gamed and the lagging KPI never improves. The fix is to validate that each leading KPI actually correlates with its lagging partner, and to drop the ones that do not. This is also where screening method shows up as a leading input: consistent, structured evaluation is itself a leading indicator of quality of hire, which is why a structured interview outperforms a gut-feel phone screen on the numbers, not just in theory.
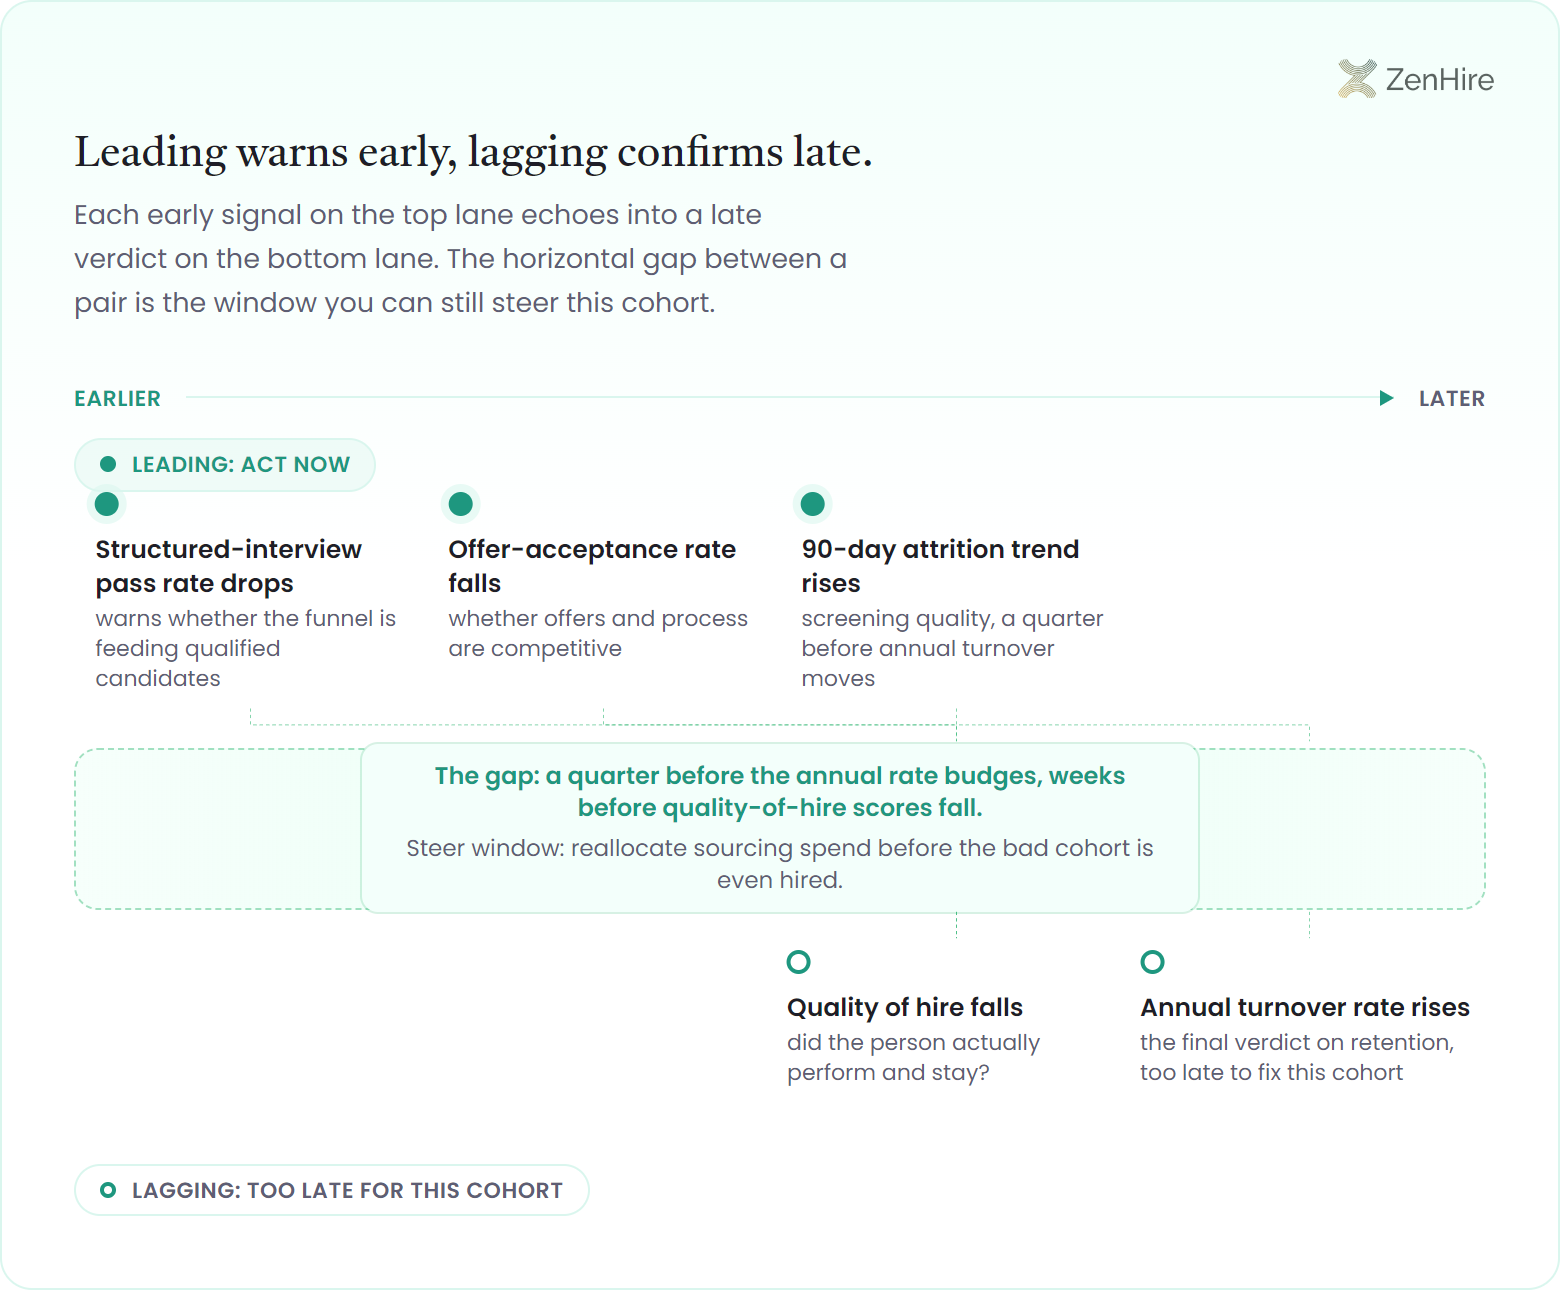
| Recruiting KPI | Type | What it warns or confirms |
|---|---|---|
| Structured-interview pass rate | Leading | Whether your funnel is feeding qualified candidates |
| 90-day attrition | Leading | Screening quality, months before annual turnover moves |
| Offer-acceptance rate | Leading | Whether your offers and process are competitive |
| Quality of hire | Lagging | Did the person actually perform and stay? |
| Annual turnover rate | Lagging | The final verdict on retention, too late to fix this cohort |
How do you turn recruiting KPIs into decisions?
You turn recruiting KPIs into decisions by segmenting every metric and pairing each one with a lever you control, so a number does not just describe the past, it points at the next action. An unsegmented dashboard tells you the building is on fire; a segmented one tells you which floor.
The mechanism is segmentation plus ownership. Break each KPI down by role, location, and hiring source, then attach it to a decision: cost per hire by source tells you which channel to cut; 90-day retention by source tells you which channel to scale; quality of hire by interviewer tells you who needs calibration. The concrete example: a team sees overall time to hire holding steady but, once segmented, finds one region 40% slower because of a scheduling bottleneck, so the decision is automating scheduling there, not launching a company-wide initiative. Consistent, structured screening is what makes this trustworthy, because the same evidence is captured for every candidate whether you hire ten or ten thousand; ZenHire's glass-box scoring and quality-of-hire signals give every decision the same auditable basis instead of one recruiter's memory of a busy Tuesday.
The edge case is the small sample. In low-volume or specialist hiring, a single bad hire can swing a percentage-based KPI wildly, so a 50% "90-day attrition" might mean one person out of two left, statistically meaningless. There, you lean on leading inputs (screening quality, structured-interview signal) and treat the lagging rate as directional, not decisive. For high-volume teams the opposite holds: the numbers are stable enough that small, segmented shifts are real, which is the whole premise of reducing time to hire without trading away quality.
About 70% of hiring teams now run AI somewhere in the funnel, and the reported gains are real: roughly 62% faster screening and 59% lower cost (industry research). But the KPI payoff is not speed for its own sake. It is that machine-scored evaluation records the same evidence for every applicant, so a cost-per-hire or 90-day-retention cut sliced by source or region reflects the candidates, not who happened to review them.

I have sat in front of a lot of recruiting dashboards, and most of them measure how busy the team is, not how well it hired. Applications received, interviews booked, emails sent: all activity, none of it outcome. The KPIs I trust are the uncomfortable ones: did the person we hired still here at 90 days, and were they actually good? Those numbers do not flatter anyone, which is exactly why they are worth tracking. A metric that cannot embarrass you is decoration. Pick the few that tie a screen to a result, segment them ruthlessly, and let the rest fall off the slide.
Frequently asked questions
What are the most important recruitment KPIs?+
The most important recruitment KPIs are quality of hire, time to hire, cost per hire, and 90-day retention: the four that tie a hiring decision to a business outcome. Quality of hire is the anchor, and the others measure how fast, how cheaply, and how durably you reach a good hire.
What is the difference between a leading and a lagging recruiting KPI?+
A leading recruiting KPI predicts an outcome early while a lagging KPI confirms it after the fact. A 90-day attrition trend is leading and warns you a quarter before annual turnover (a lagging KPI) moves, so you can fix the sourcing channel or screen while it still matters.
How many recruiting metrics should I track?+
You should track a small set of recruiting metrics that each map to a decision, typically the four anchor KPIs plus one or two leading indicators per role family. A dashboard with thirty metrics and no actions is a report; the discipline is dropping any number you cannot act on.
Is cost per hire a good recruiting KPI on its own?+
Cost per hire is misleading on its own because a low number means nothing if the hire leaves early. Read it alongside 90-day retention and quality of hire, since replacing a frontline worker can cost $5,000-$20,000 and SHRM puts skilled replacement at 50-200% of salary.
How do recruiting KPIs connect to screening method?+
Screening method is a leading input to your quality-of-hire KPI. The predictive validity of the screen sets the ceiling on the outcome: an unstructured interview lands near 0.18 against on-the-job performance, while a structured interview backed by validated assessments reaches past 0.6. Tighten the screen and the KPI improves before the first new hire in that cohort is even made.
Free for recruitment KPIs
The recruiting KPI starter pack
A one-page sheet of the recruiting metrics that matter: the four anchor KPIs, their leading-indicator partners, and the exact decision each one should drive.