Which Talent Acquisition Metrics Should You Track?
· 10 min read
Track the five talent acquisition metrics that tie a hiring decision to a business outcome: quality of hire, time to fill, cost per hire, source effectiveness, and 90-day retention. Quality of hire anchors the set, and it moves with how you screen: an unstructured interview reads out at just ~0.18 validity against later performance, whereas structured interviews layered with cognitive and skills assessments clear 0.6. Because a walked-away frontline hire costs $5,000-$20,000 to replace and SHRM prices a skilled-role exit at 50-200% of salary, the metric that guards your budget is 90-day retention, not how quickly a seat closed.
Which talent acquisition metrics matter most?
**The talent acquisition metrics that matter most are the few that tie a hiring decision to a business outcome: quality of hire, time to fill, cost per hire, source effectiveness, and early retention. Everything else on a TA dashboard is either an input to one of these or a vanity count that fills a slide without changing what the team does next. If a number cannot finish the sentence "so we will hire differently," it does not earn a place on the report.
Quality of hire is the anchor because it answers the only question that ultimately matters: did this person perform and stay? Time to fill and cost per hire are the efficiency pair, how fast and how cheaply you reach a good hire, while source effectiveness tells you which channels deliver hires who last, and early retention is the honesty check that catches a fast, cheap hire who walks at week six. Read them together. An in-house team optimizing time to fill in isolation will eventually trade speed for mismatch, and the cost per hire number glows green right up until you pay to replace the person. Pair the set with a deliberate TA strategy so the metrics serve a plan, not the other way around.
The concrete example: an in-house TA team celebrates filling 200 frontline seats in three weeks at a low cost per hire, then watches roughly half leave inside 90 days. The vanity metrics (req fill speed, low cost) all read green; the outcome metric (early retention) was red the whole time and nobody was watching it. The edge case is the senior or specialist hire, where volume metrics barely apply; there, quality of hire and time-to-productivity dominate, and a slow, expensive search can still be the right call.
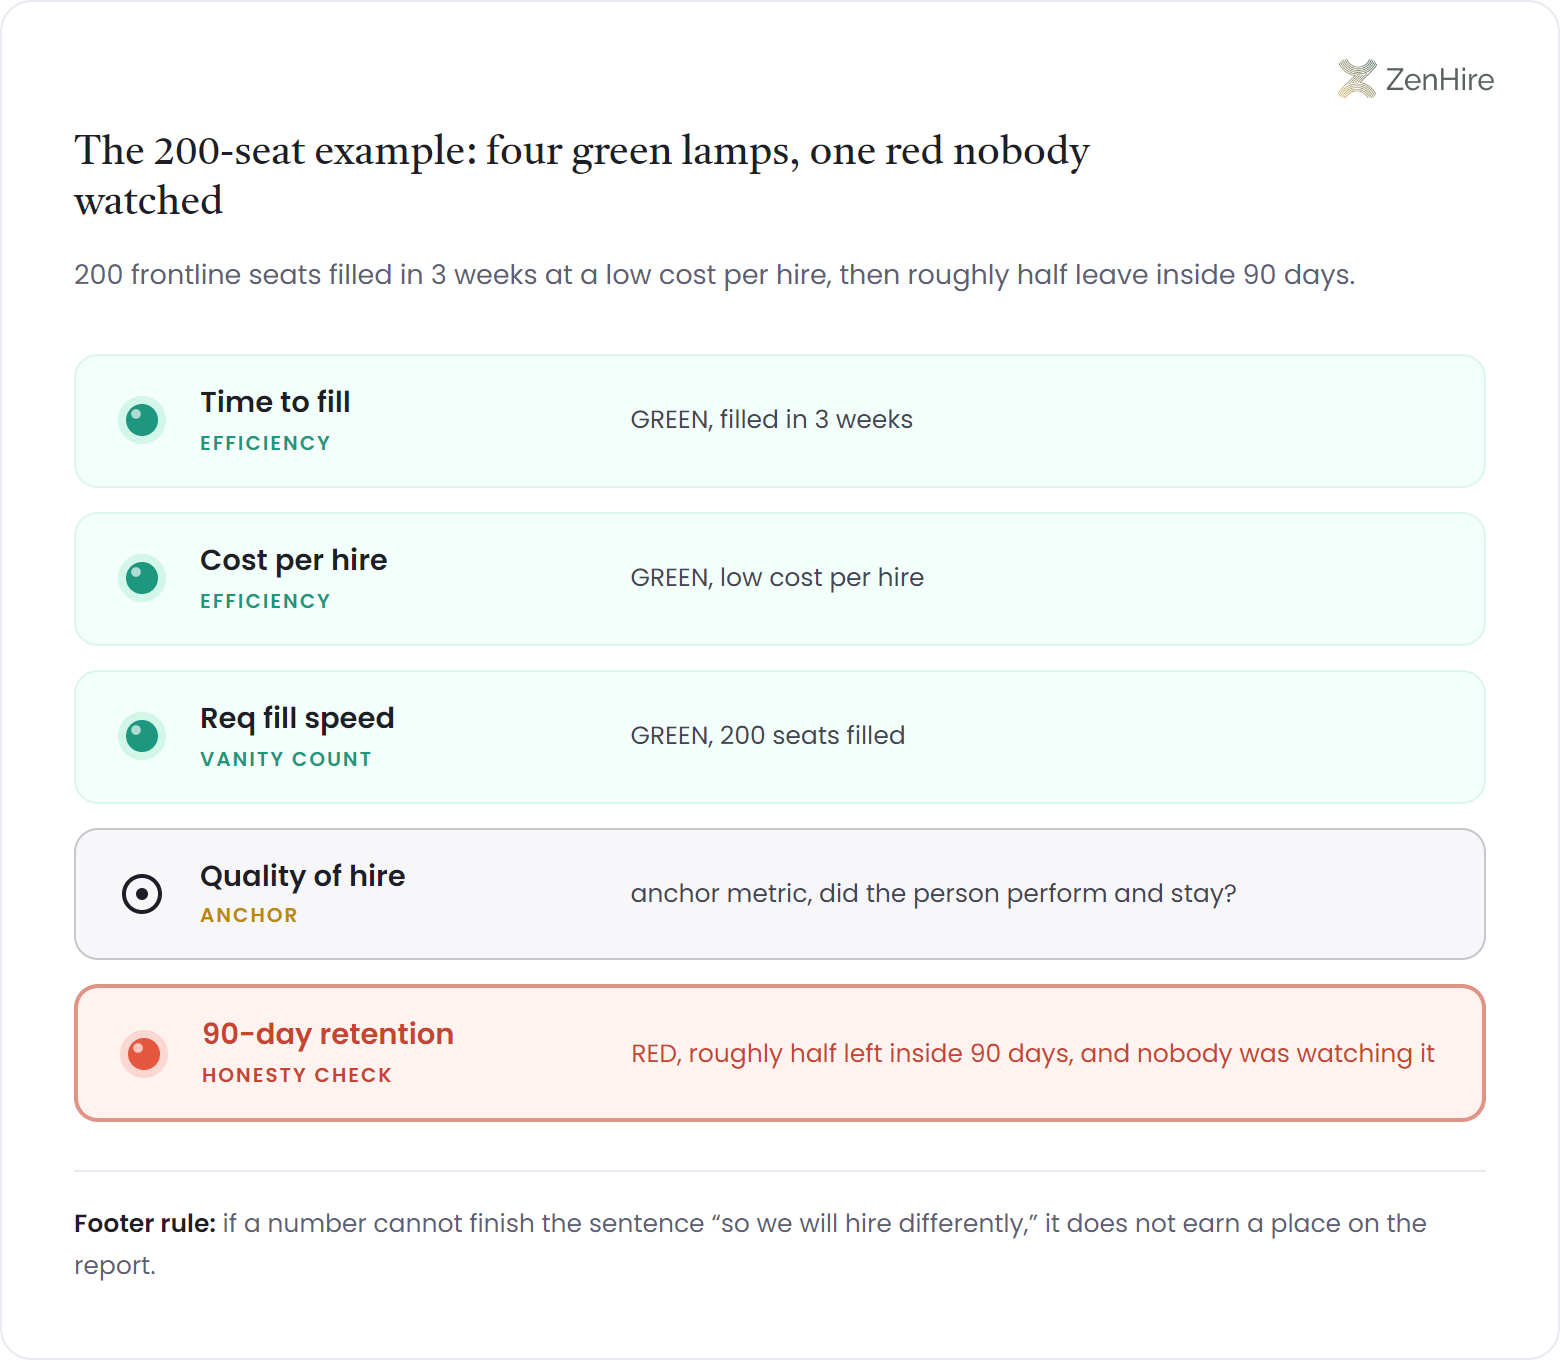
Replacing one frontline hire runs about $5,000-$20,000 (industry estimates), and SHRM puts skilled-role replacement at 50-200% of annual salary. That is why early retention, not raw fill speed, is the metric that protects the budget; a low cost per hire means nothing if you pay it twice. Bringing the work in-house only sharpens the point: there is no 15-25% of first-year salary agency placement fee to hide a mis-hire behind.
- Quality of hire: does the person perform and stay? The anchor metric every other number serves
- Time to fill: elapsed days from open req to accepted offer; a good seat unfilled is a revenue leak
- Cost per hire: fully loaded spend per accepted offer, including sourcing, tooling, and recruiter time
- Source effectiveness: which channels deliver hires who pass probation and stay, not just who applies
- 90-day retention: the share of new hires still in seat at 90 days; the honesty check on the four above
How do talent acquisition metrics prove team impact?
Talent acquisition metrics prove team impact when they connect a screening change to a business outcome you can put a number on: a cohort that performs better, a seat filled faster, a replacement cost avoided. An in-house TA team earns its budget not by showing how many candidates it touched, but by showing that the people it hired were measurably better and stayed measurably longer.
The mechanism is the before-and-after, held against a controlled variable. Pick a lever the team owns, whether a structured scorecard, a new assessment, or a reweighted source mix, then change it for one role family, and watch the outcome metric move while everything else stays constant. The concrete example: a TA team introduces a structured interview for one location's frontline roles and, a quarter later, that location's 90-day retention is eight points higher than the unchanged locations, with quality-of-hire scores to match. That is impact you can defend, because it is tied to a decision the team made and a metric the business already cares about. What makes the metric move is the validity gap underneath it: a plain resume review only tracks performance at about r = 0.14 and an unstructured interview at ~0.18, but stack structured interviews with cognitive and skills assessments and the combined signal clears 0.6, over four times the predictive power, and that multiple is precisely what a good quality-of-hire metric is built to surface.
The edge case is the small sample. In low-volume or specialist hiring, a single bad hire can swing a percentage-based metric wildly; a 50% "90-day attrition" might mean one person out of two left, which is statistically meaningless. There, you lean on leading inputs (screening consistency, structured-interview signal) and treat the lagging rate as directional, not decisive. Consistency is what makes the proof trustworthy at any volume: ZenHire's AI interview software scores every candidate the same way on communication, soft skills, and reliability in a few minutes, so the same evidence is captured whether you hire ten people or ten thousand, and the metric reflects the change you made, not which recruiter happened to run the screen.
Read the metric as a ladder of validity: a resume scan tracks later performance at roughly r = 0.14, an unstructured interview at ~0.18, a structured interview at 0.28, and a structured interview paired with cognitive and skills assessments past 0.6+. A quality-of-hire number that climbs after you change the screen is that ladder made legible, the same lift restated in a figure leadership can read.
| TA metric | What an improvement proves |
|---|---|
| Quality of hire | The team is hiring people who perform and stay, not just fill seats |
| 90-day retention | Screening is catching mismatch before the offer, not after training spend |
| Source effectiveness | Budget is flowing to channels that deliver hires who last |
| Time-to-productivity | New hires reach output faster, shrinking the cost of every replacement |
How do you report talent acquisition metrics to leadership?
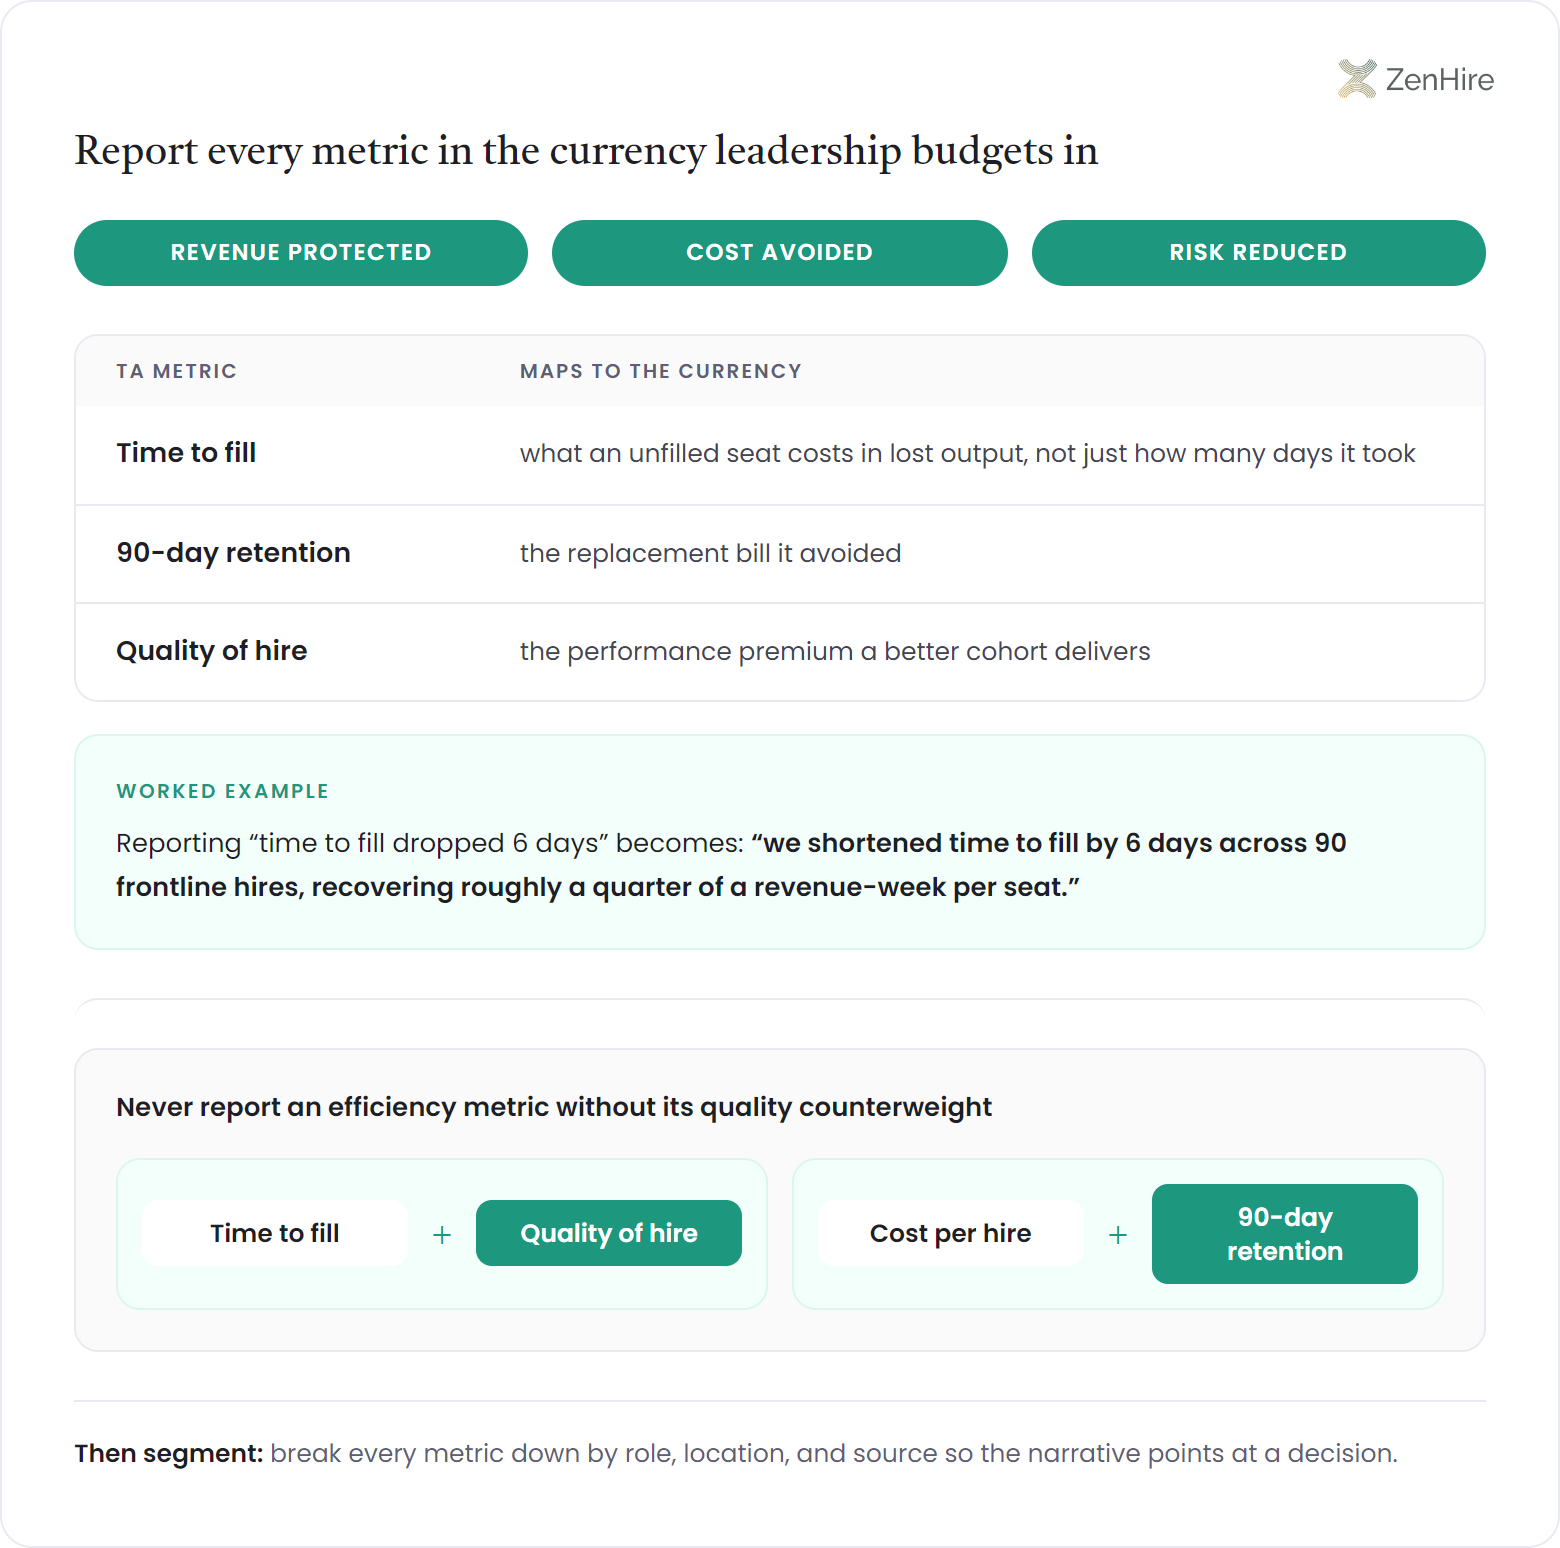
You report talent acquisition metrics to leadership by translating each number into revenue protected, cost avoided, or risk reduced, then segmenting it so the story is specific, not by handing over a wall of recruiting KPIs and hoping the board connects the dots. Leadership funds outcomes; your job is to express TA metrics in the currency they already budget in.
The mechanism is translation plus segmentation. Take time to fill and say what an unfilled seat costs in lost output, not just how many days it took; take 90-day retention and attach the replacement bill it avoided; take quality of hire and tie it to the performance premium a better cohort delivers. Then break each metric down by role, location, and source across the recruitment funnel so the narrative points at a decision: cost per hire by source tells leadership which channel to cut, retention by source tells them which to scale. The concrete example: instead of reporting "time to fill dropped 6 days," a TA leader reports "we shortened time to fill by 6 days across 90 frontline hires, recovering roughly a quarter of a revenue-week per seat and clearing the launch on schedule": same metric, but now it lands as a business result. It helps to set this against the macro backdrop leadership already feels: the global recruitment market is on a path from roughly $450B (2023) toward $870B (2032), a steady climb that makes every point of in-house efficiency compound.
The edge case is the metric that moved for the wrong reason, a Goodhart problem in the boardroom. Time to fill can drop because the team lowered the bar, and cost per hire can fall because you stopped sourcing the channels that actually convert. The fix is to never report an efficiency metric without its quality counterweight: pair time to fill with quality of hire, pair cost per hire with 90-day retention, so leadership sees that speed and savings did not come at the cost of the result. This is also where consistent, auditable scoring earns its keep: when every candidate is evaluated the same way, a reported improvement is a real signal, not an artifact of who screened whom. Compare the in-house picture against the in-house versus agency math so leadership sees where the team's control over the funnel is actually paying off.
By 2025, roughly 70% of hiring teams use AI somewhere in the process, and they report about 62% faster screening and 59% lower cost (industry research). For a metrics report, the payoff is not the speed; it is that machine-scored evaluation keeps the measure consistent across thousands of candidates, so the delta you show the board reflects the hiring change rather than which recruiter graded whom.

I am building an AI recruiter, so I see a lot of TA dashboards, and most of them measure how busy the team is, not how well it hired. Candidates sourced, interviews booked, reqs touched: all motion, none of it outcome. The metrics I trust are the ones that can embarrass you: was the person we hired still here at 90 days, and were they actually good? An in-house TA team that reports those numbers honestly, segmented and tied to a dollar figure, becomes impossible to treat as a cost center. The trap is reporting activity to a board that funds outcomes. Pick the few metrics that tie a screen to a result, make sure every candidate is scored the same way so the numbers are real, and let the vanity counts fall off the slide.
Frequently asked questions
Which talent acquisition metrics should an in-house team track first?+
An in-house team should track quality of hire, time to fill, cost per hire, source effectiveness, and 90-day retention first: the five that tie a hiring decision to a business outcome. Quality of hire is the anchor; the others measure how fast, how cheaply, from where, and how durably you reach a good hire.
What is the difference between TA metrics and recruiting activity counts?+
TA metrics measure outcomes while activity counts measure motion. Candidates sourced and interviews booked tell you the team was busy, but quality of hire and 90-day retention tell you whether it hired well. If a number cannot map to a decision you would change, it is an activity count, not a metric worth reporting.
How do talent acquisition metrics prove the team's impact?+
Talent acquisition metrics prove impact when a screening change moves an outcome you can price. Change one lever for one role family, hold the rest constant, and show the quality-of-hire or retention lift as a defensible before-and-after; the room for that lift is real, since moving from an unstructured interview at ~0.18 to combined structured interviews and assessments past 0.6 is where the added predictive validity comes from.
How should I report TA metrics to leadership?+
Report TA metrics in the currency leadership budgets in (revenue protected, cost avoided, risk reduced) and segment by role, location, and source. Translate "time to fill dropped 6 days" into the revenue-weeks recovered, and always pair an efficiency metric with its quality counterweight so speed did not come at the cost of the result.
Is cost per hire a good TA metric on its own?+
Cost per hire is misleading on its own because a cheap hire who leaves early is the most expensive kind. Read it against 90-day retention and quality of hire, since a departed frontline worker costs $5,000-$20,000 to replace and SHRM prices a skilled-role exit at 50-200% of salary, bills a low cost-per-hire figure hides until you pay it twice.
Free for talent acquisition metrics
The TA metrics reporting pack
A one-page sheet of the talent acquisition metrics that matter to an in-house team: the anchor KPIs, their leading-indicator partners, and how to translate each into a number leadership funds.